Cheap is about price. Undervalued is about price compared to what the business is actually worth.
Let that sink in a bit. We all know cheap is just cheap. But what if you could buy into a business for less than what it's actually worth?
Confusing cheap for undervalued is probably the most expensive mistake new investors make, and it's an easy one to make, because cheap is visible and value is not.
Why a falling price tells you almost nothing
A stock down 60% could be a good company caught in a bad market.
It could also be a company whose business is genuinely deteriorating — in which case the price isn't a discount. It's the market being roughly right.
The chart cannot tell you which. Only the business can.
What to look at instead
Start with whether the company earns money, and whether that number is going up or down over several years rather than one quarter.
One bad quarter is noise. Four bad quarters in a row is a story.
Then look at debt. A company with some debt and falling earnings has time to fix itself. A company with heavy debt and falling earnings may not.
Then ask the plainest question available: do I understand how this business makes money, well enough to explain it to someone at dinner?
If not, no valuation model is going to save you, because you won't know when the story has changed.
Where fair value comes in
If all of that seems a bit confusing or too much to wrap your head around, you might enjoy using a few of the business evaluation models that have been used for decades. These include the Discounted Cash Flow model, the Fair Value model, the Dividend Discount model and the Peter Lynch valuation model.
All of them do their best to estimate what a business is worth. And estimating what a business is worth means making a guess about the cash it will produce in the future, then deciding what that future cash is worth today.
It is arithmetic wrapped around assumptions.
The arithmetic is reliable. The assumptions are guesses. Change any of the inputs and the valuation can change enormously.
Anyone who shows you a fair value figure without telling you the assumptions behind it is showing you a number, not an analysis.
This is why we teach you to run the model yourself rather than trust the output. The value is in seeing which assumptions the answer depends on.
Two kinds of companies, two kinds of models
There are two types of fair value calculation most investors should be aware of.
Mature, steady-growth companies fit a common Discounted Cash Flow model reasonably well, because their future is a plausible extension of their past.
Growth companies are the harder case. Their recent growth rate, if you let the model run with it, produces a valuation that assumes the last few years repeat forever — which is exactly the assumption that tends not to hold. So the growth number usually needs capping to something more sober. Nvidia and the newer AI companies sit squarely in this category.
Here is Nvidia on the evening of 3 August.
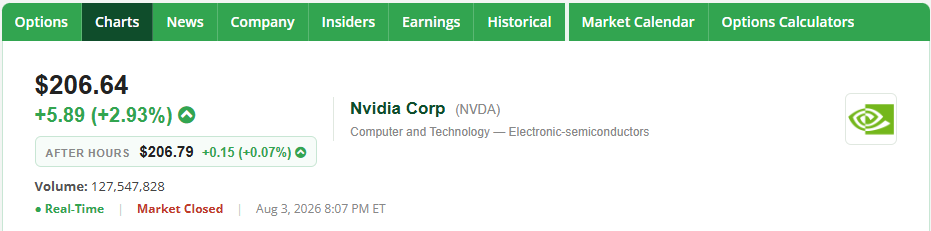

Three numbers, and the useful part is the relationship between them.
The share price sits below the fair value estimate rather than above it, and the panel says so in plain language: within 25% of fair value.
Notice what that sentence does not say. It doesn't say the stock is going up. It doesn't say the analysts are right. It says that on the assumptions the model used, you would not be paying a large premium to what the business appears to be worth.
And it's worth saying out loud that Nvidia is a growth company, so that $248.44 is resting on a capped growth assumption. Change the cap and the number moves. That isn't a flaw in the model — it's the whole reason to know what went into it.
Being able to buy shares somewhere around fair value is what a reasonable entry looks like. We don't want to buy a stock because the price is cheap. We want to buy a stock because it's undervalued.
Those are two completely different sentences, and only one of them is about the business.
Why this matters to you personally
You probably wouldn't buy an investment property without knowing what it's actually worth.
The same should be said for your investment portfolio.
Being able to see the fair value for any stock in a couple of seconds gives you the one thing a price chart can never give you: something to compare the price to.
What to take away
- Cheap describes the price. Undervalued describes the gap between price and worth.
- A falling chart is a question, not an answer.
- Earnings trend over years, debt load, and whether you understand the business get you most of the way.
- Growth companies need their growth assumption capped, or the model flatters them.
- A fair value estimate is only as good as the assumptions you fed it. Know them.
Cheap compared to last year. Undervalued compared to the business.
Now go do it on something you own
The fastest way to make this concrete is to run it on the stocks already sitting in your account.
- List the holdings you bought because they had "come down a lot."
- Look up the fair value for each one and compare it to what you paid.
- Did you buy them cheap, or did you buy them undervalued?
- Then ask the harder version: would you buy them again at today's price?
$0.99 for 14 days, then $24.99/month. Cancel online anytime.
Figures captured on 3 August 2026 and they have moved since. Nvidia appears here because it is the clearest example of a growth company whose valuation depends heavily on the growth assumption you choose — nothing above is a view on whether you should own it.
A lesson, not advice. Companies named are teaching examples, not recommendations. Investing involves risk, including the loss of the money you invest. Full disclosures.